What information is available in the Dashboard?
-

- RedHunt Labs Author
 31 March 2023
What information is available in the Dashboard?
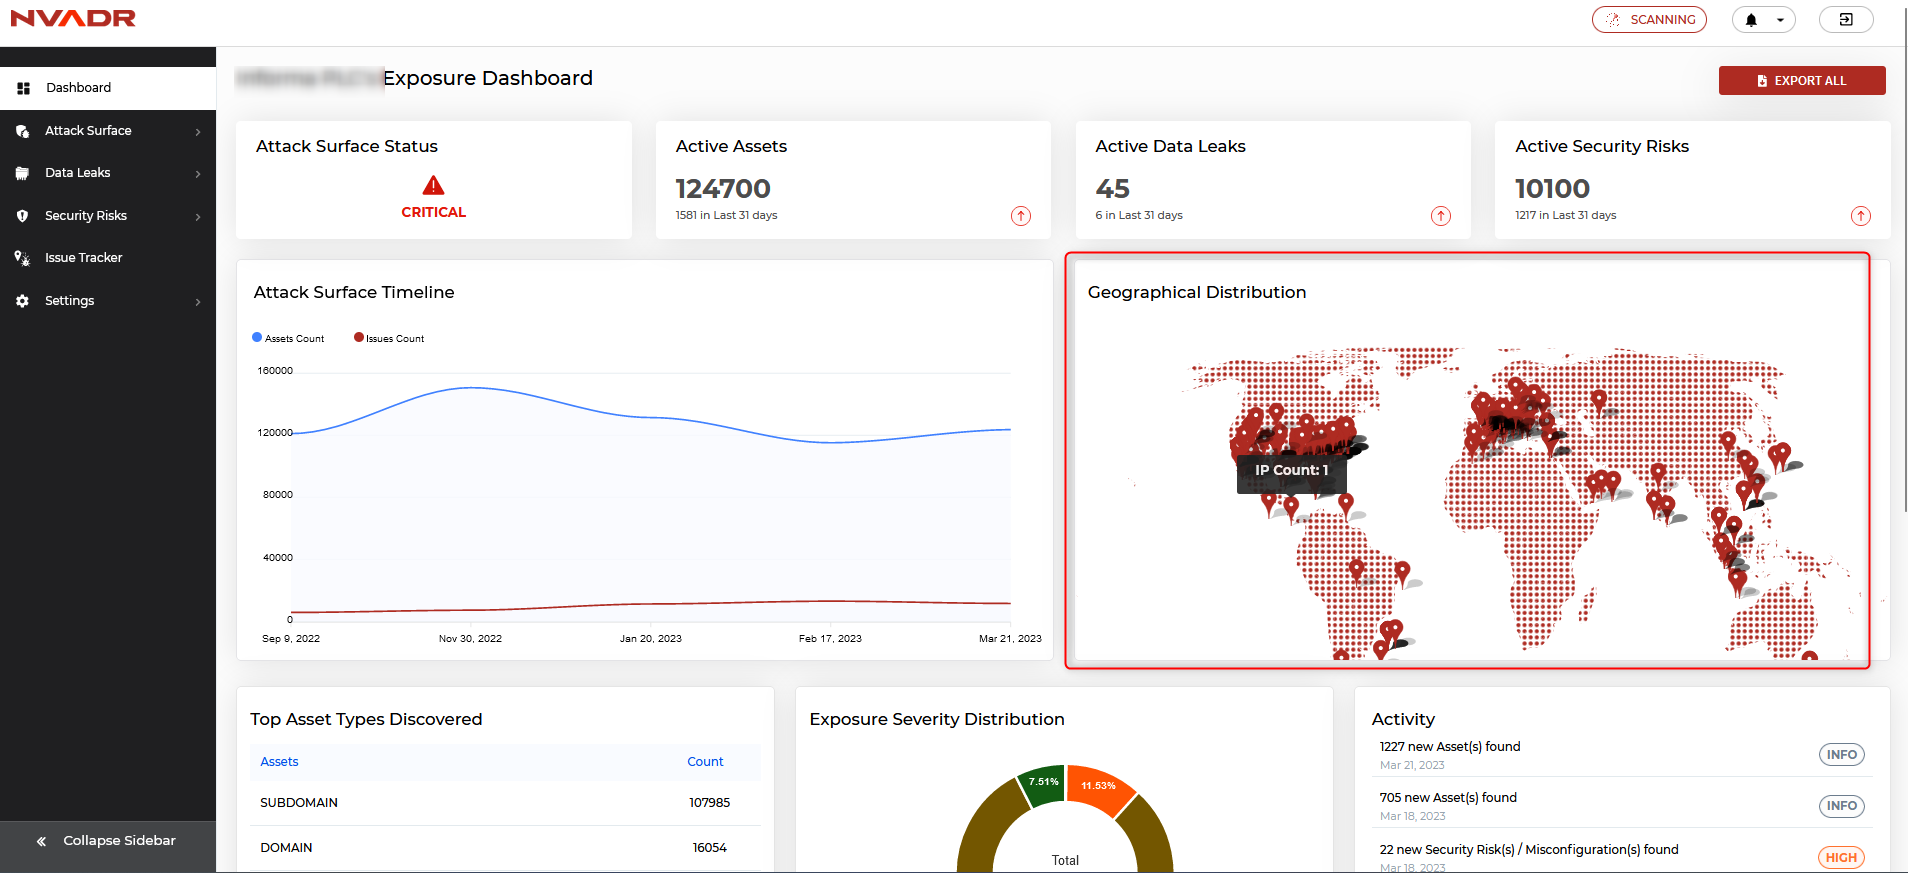
NVADR serves as an attack surface management platform, which helps to detect and protect all the vulnerable attack surfaces within your organization from external attacks. Additionally, NVADR includes a data leak detection feature that scans your organization's IT network and identifies all exposed sensitive data. By using NVADR's dashboard, you can easily access and review information regarding your organization's assets, issues, and data leaks.
Attack Surface Status
This feature presents an evaluation of the severity of the issues detected on your attack surface, offering insight into the level of risk posed by the identified vulnerabilities. The system assesses these risks on a scale that ranges from INFO, LOW, MODERATE, HIGH, to CRITICAL.
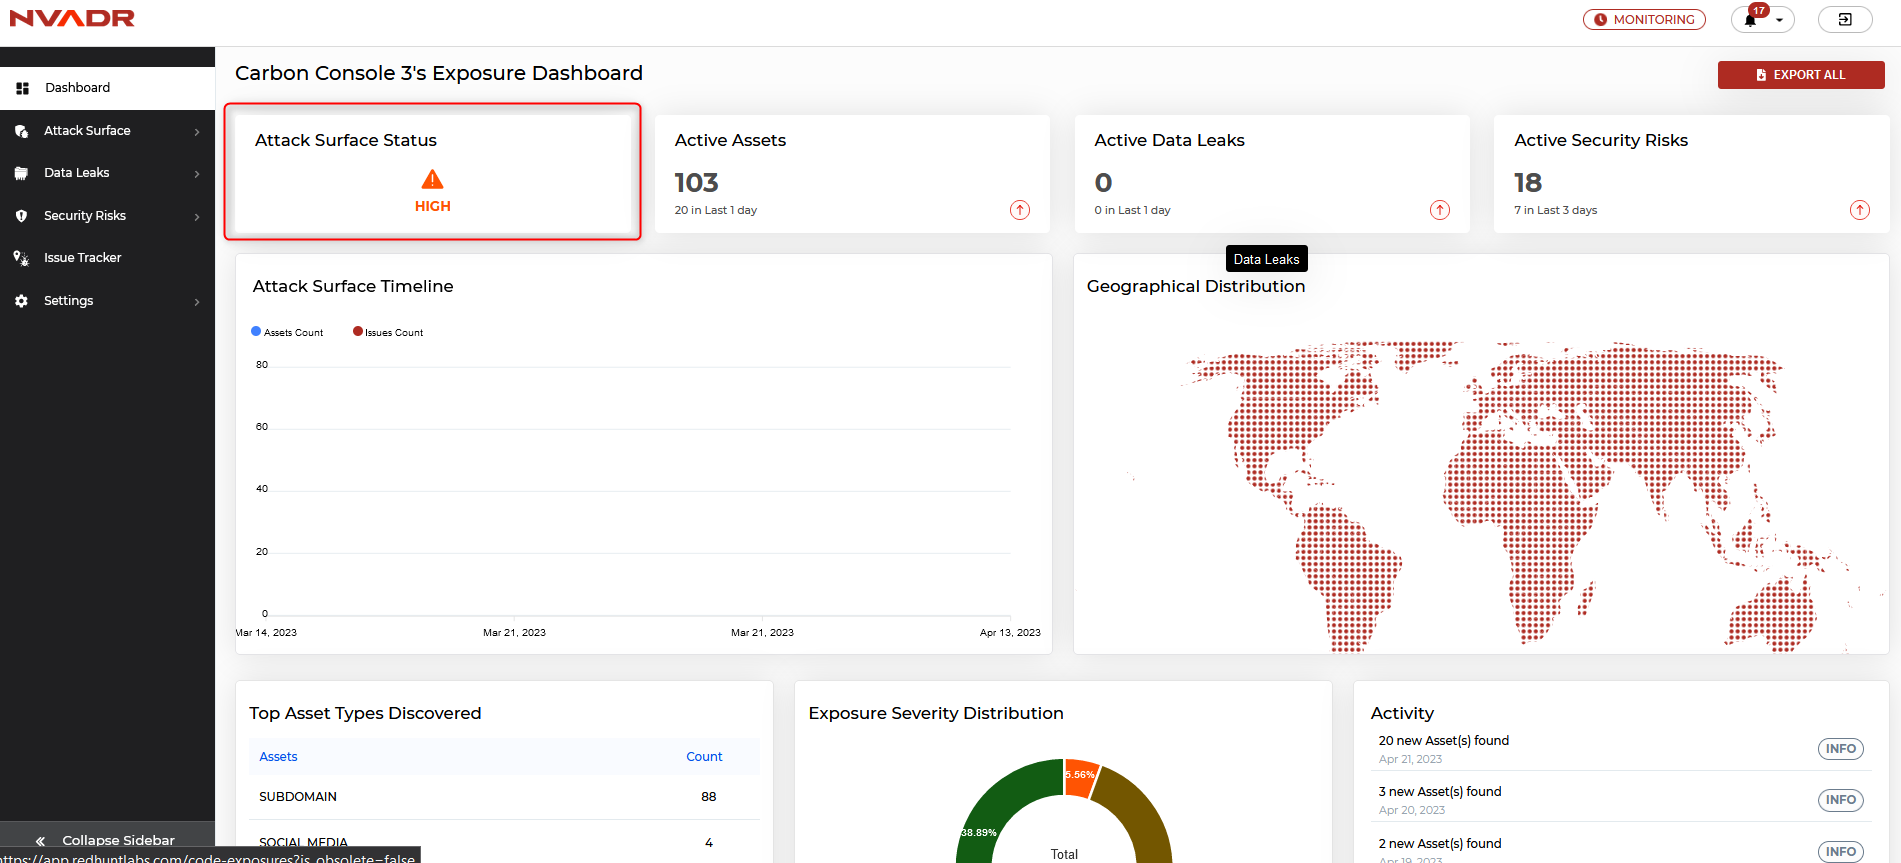
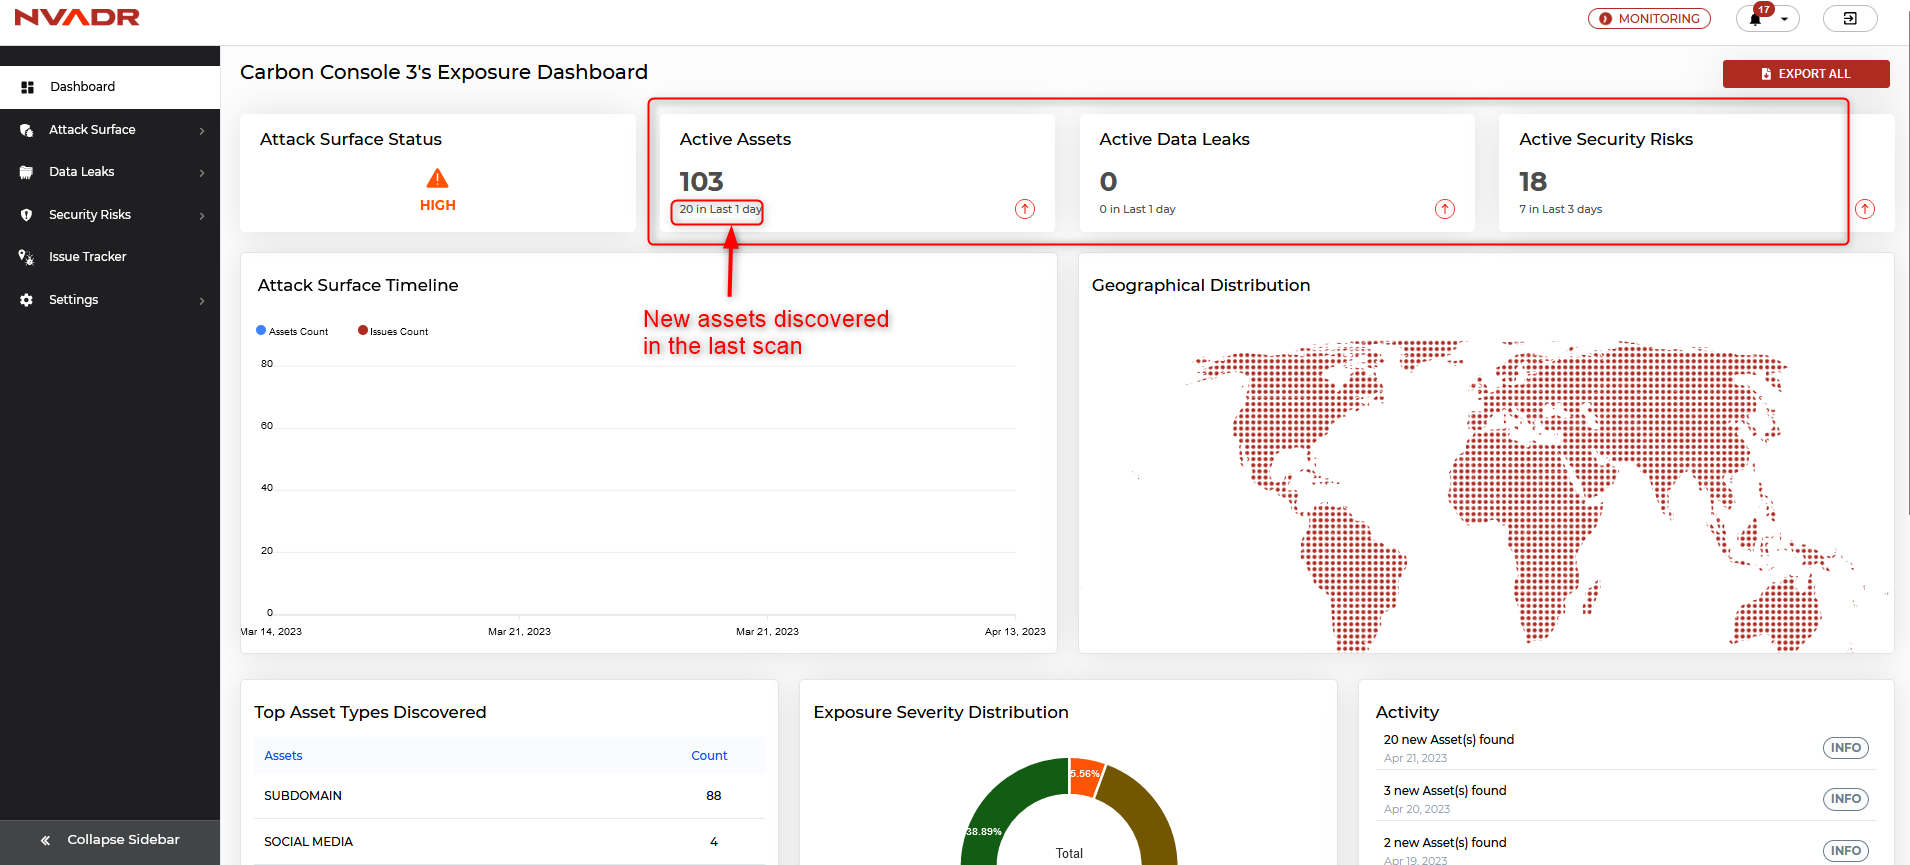
Number of Active Entities
- Active Assets - The total number of active assets is displayed here. Also, the number of new assets discovered in the last scan is also displayed.
- Active Data leaks - The total number of active data leaks is displayed here. Also, the number of new data leaks discovered in the last scan is also displayed.
- Active Security Risks - The total number of active issues/ security risks is displayed here. Also, the number of new security risks discovered in the last scan is also displayed.
Attack Surface Timeline
- In this section, a graph is displayed that illustrates the number of assets and issues identified for specific dates. This graphical representation offers a comprehensive understanding of the development of an organization's attack surface over time.
- By hovering over the data points for a specific date, users can view the number of assets and vulnerabilities detected on that particular date.
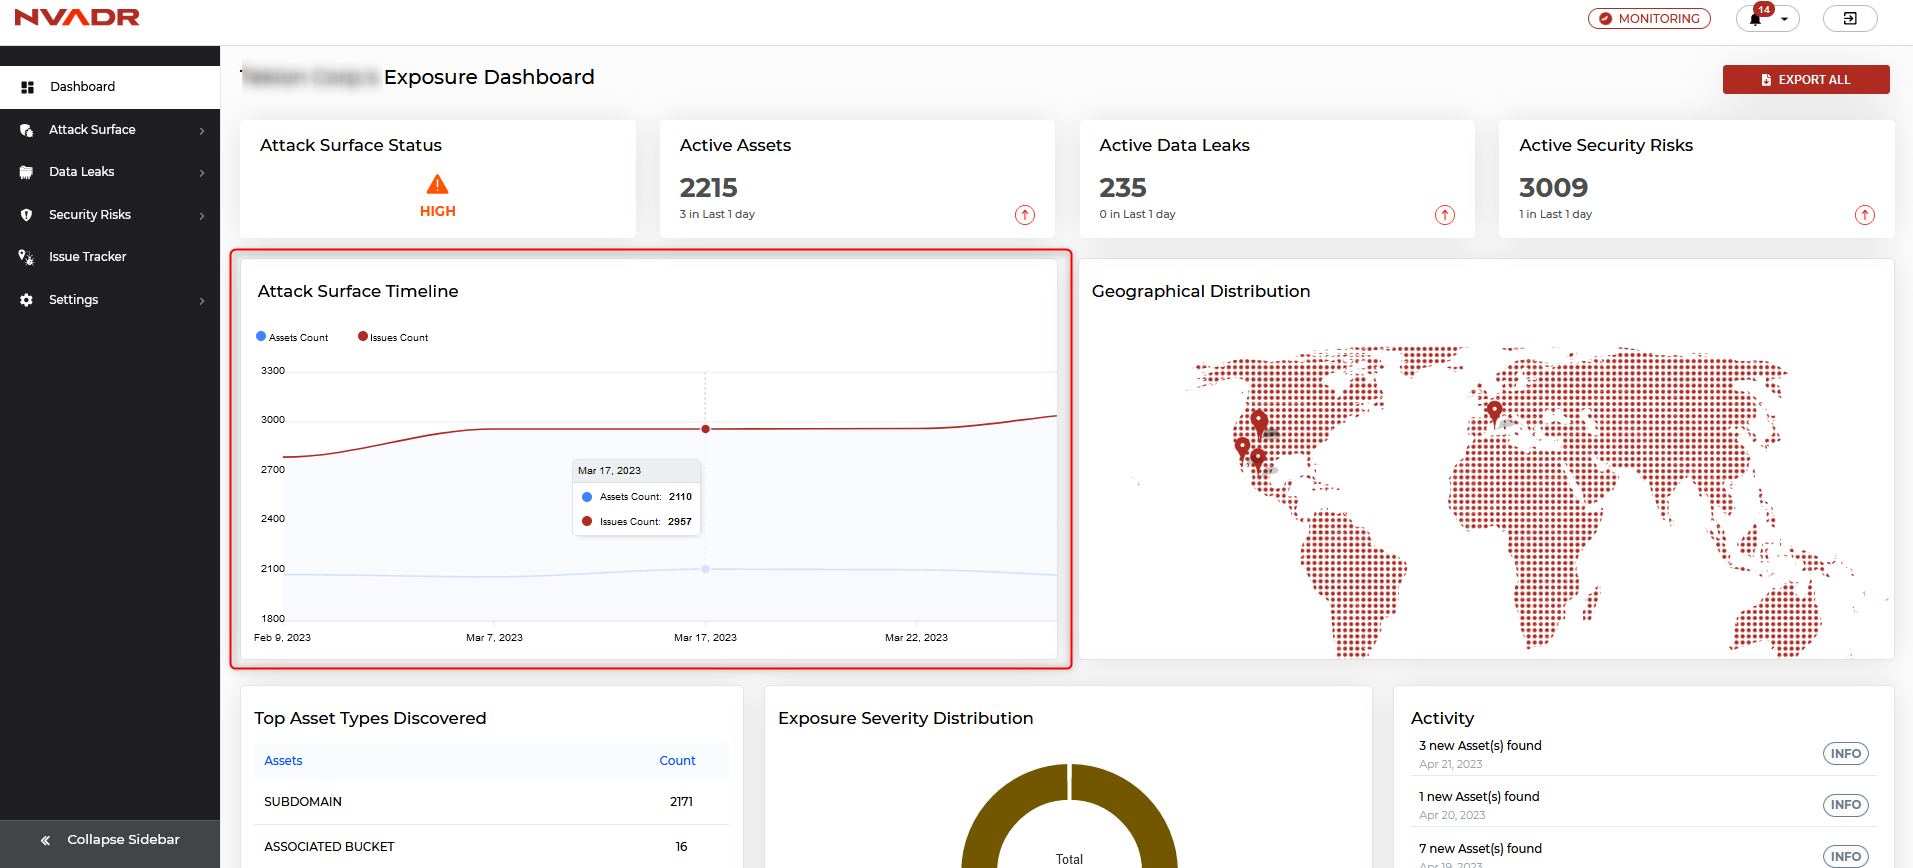
Geographical Distribution
- This section features a world map that displays the number of IP counts of assets.
- By hovering over the pins on the map, users can view the number of IPs associated with that particular location.
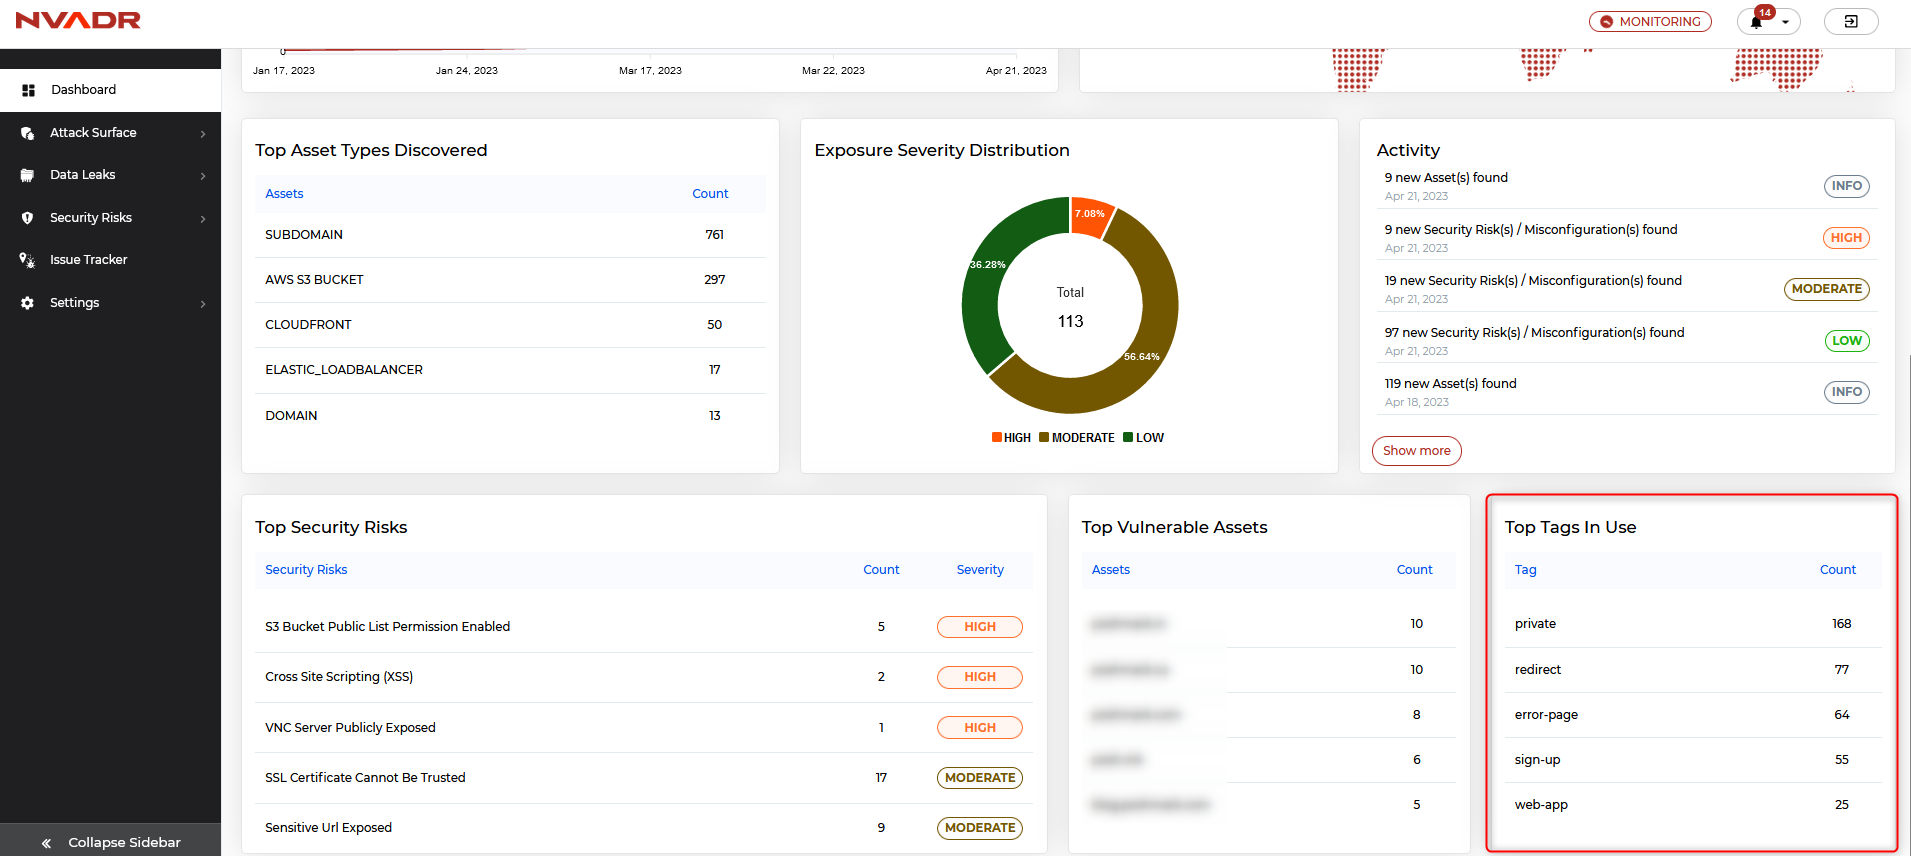
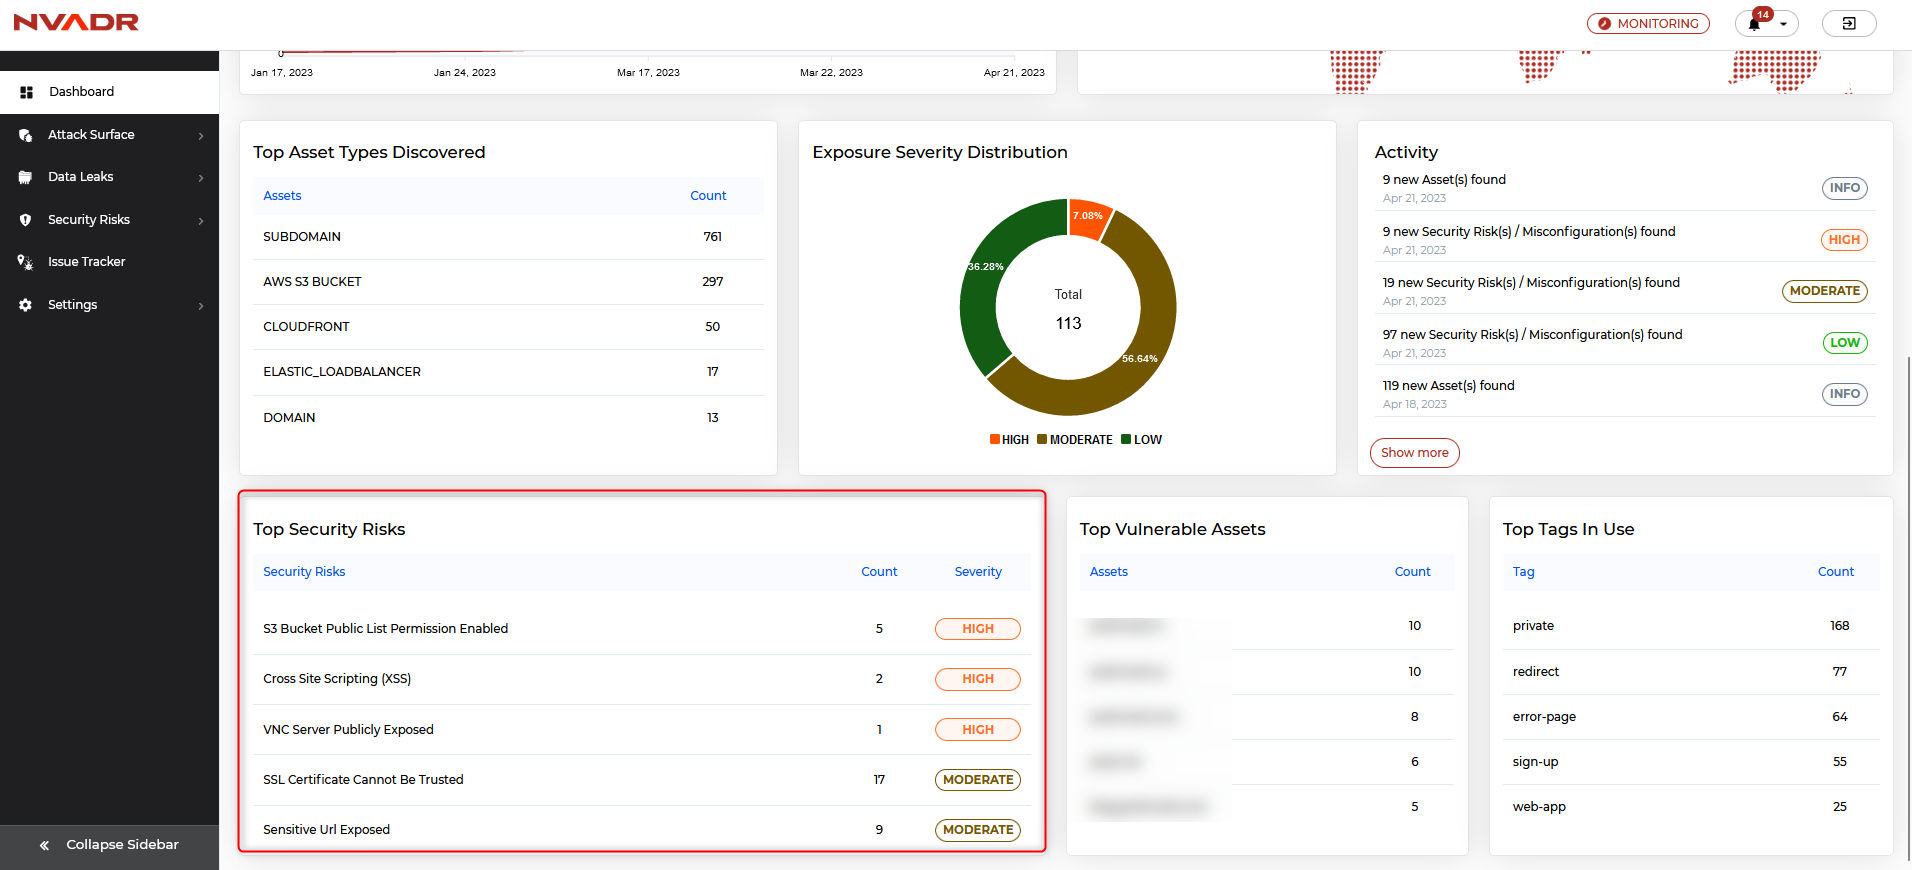
Exposure Severity Distribution
- This section showcases a pie chart that categorizes vulnerabilities based on their severity levels (LOW, MODERATE, HIGH, CRITICAL).
- By clicking on any of the severity levels in the legend, the corresponding segment is highlighted on the pie chart.
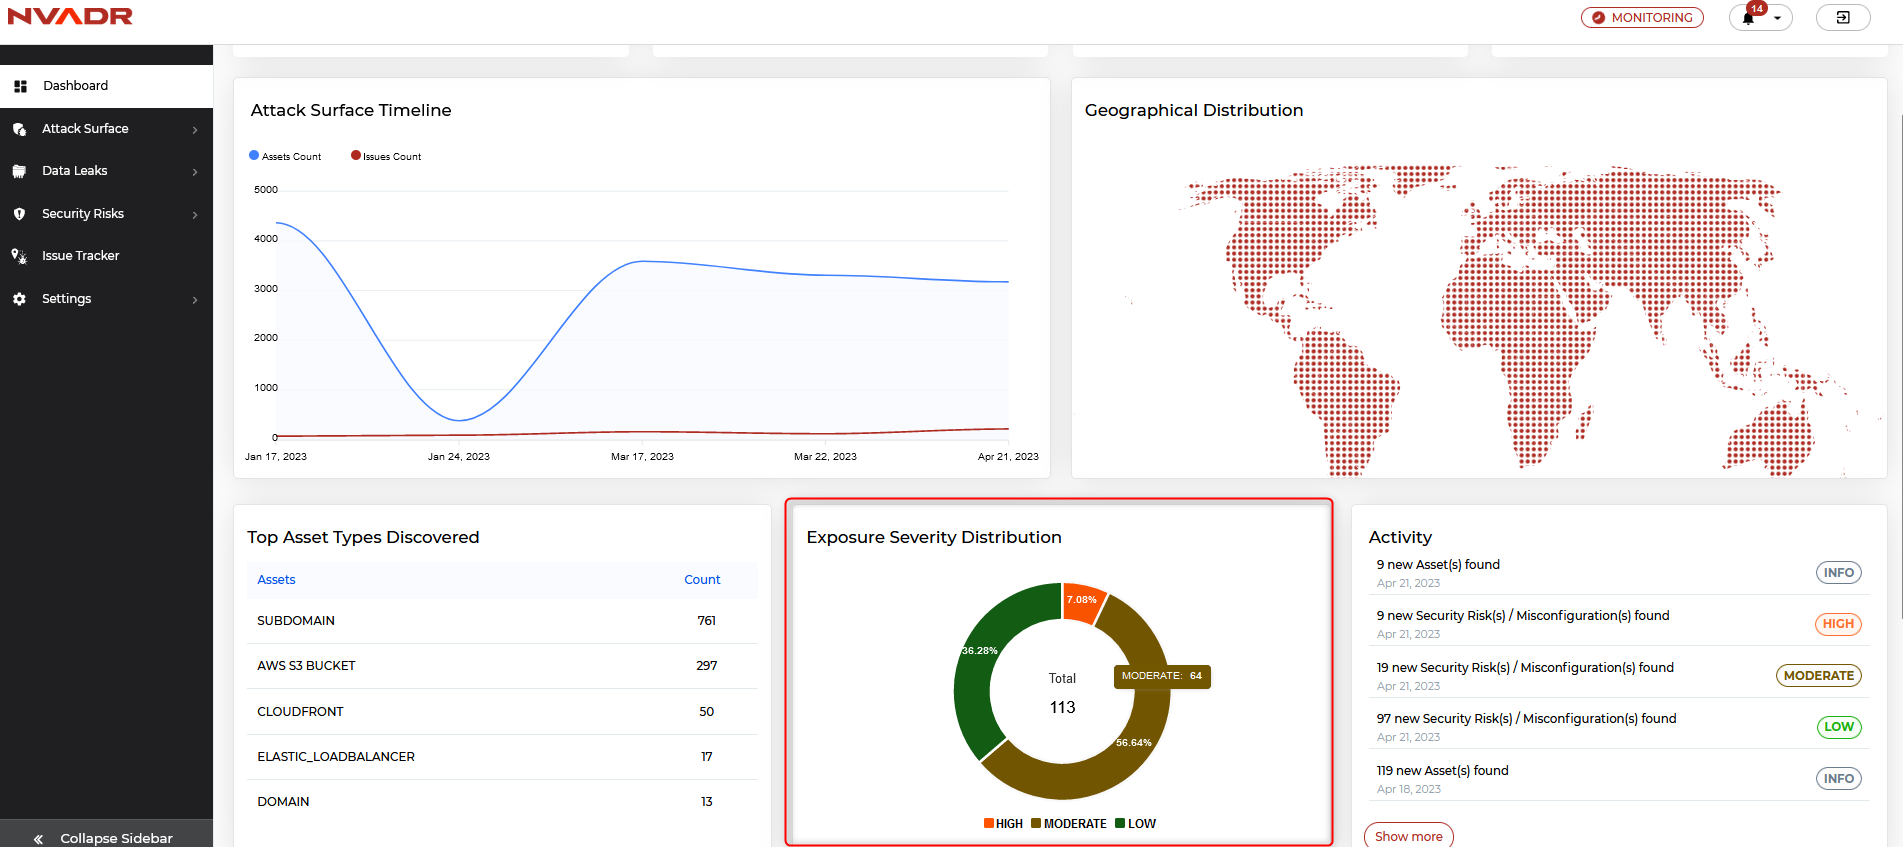
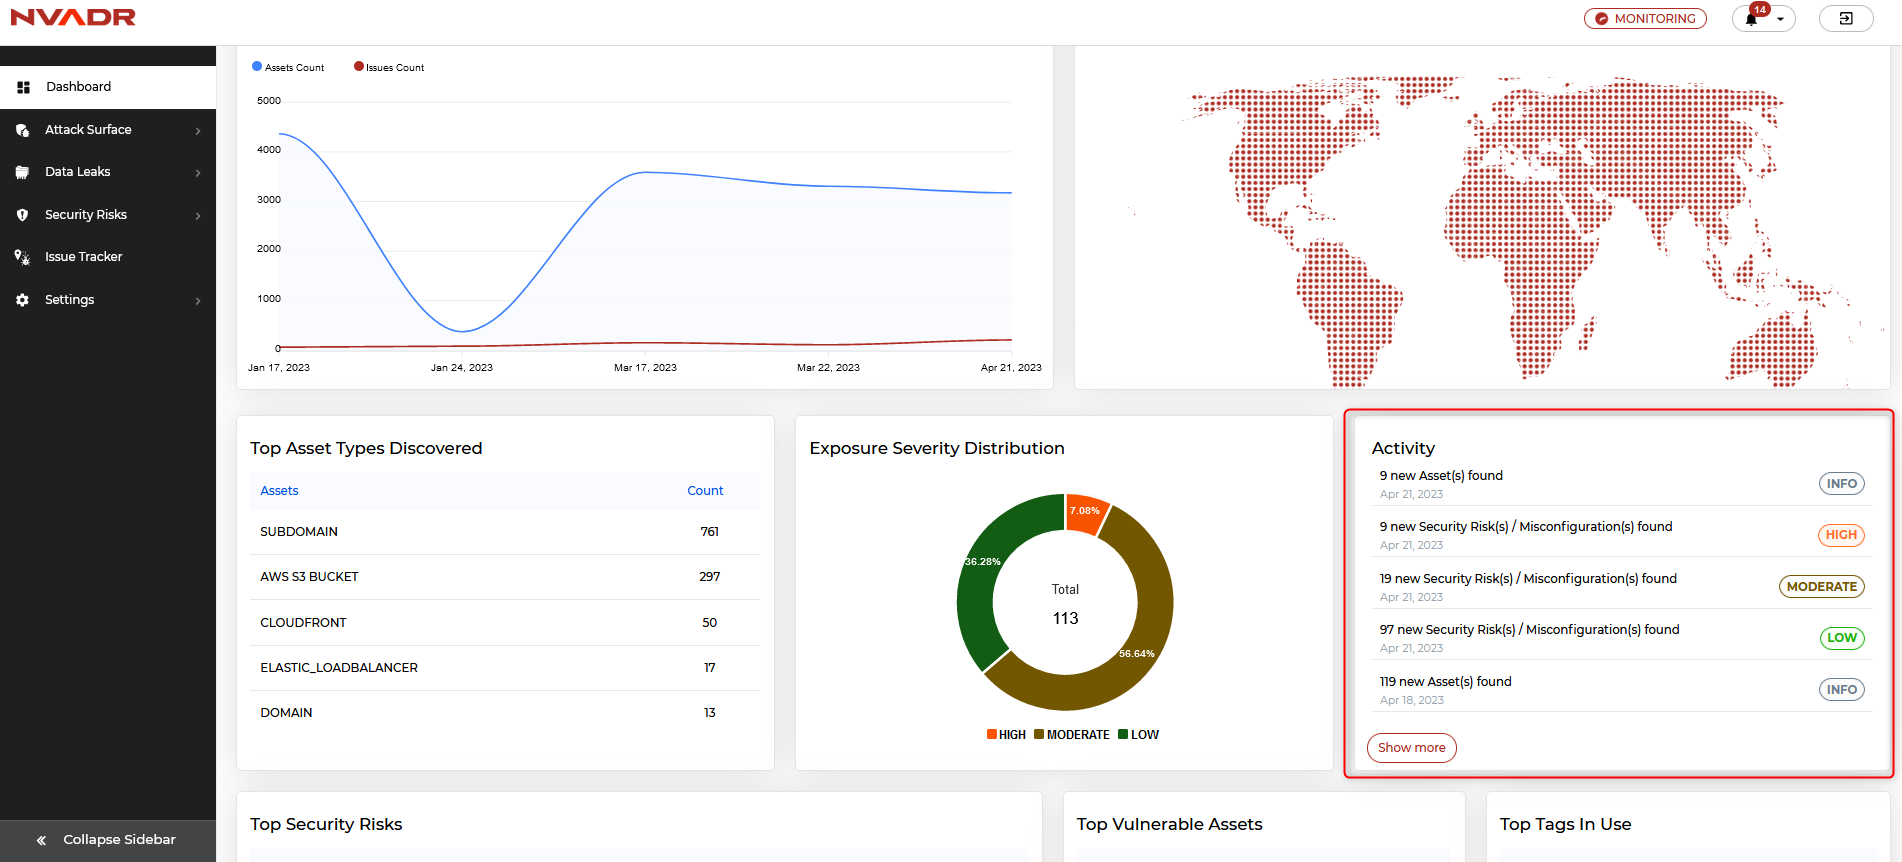
Activity
- On the platform, you can access up-to-date information regarding newly found assets, security vulnerabilities, and incidents of data breaches.
- Upon selecting a specific notification, you will be directed to a webpage where you can view all the related records, including the date of first and last sighting, as well as its current status.
- In order to view older notifications beyond those featured in the "Activity" section, simply click the "Show More" button located at the bottom of the page, which will take you to the full list of notifications.
- To learn about NVADR's notifications, check this article - Where can I find notifications in NVADR?
Top Asset Types Discovered
- In this segment, you will find a hierarchy of asset types arranged in a descending order.
- By selecting a particular asset type, you will be directed to a page that exhibits the corresponding records for that asset type.
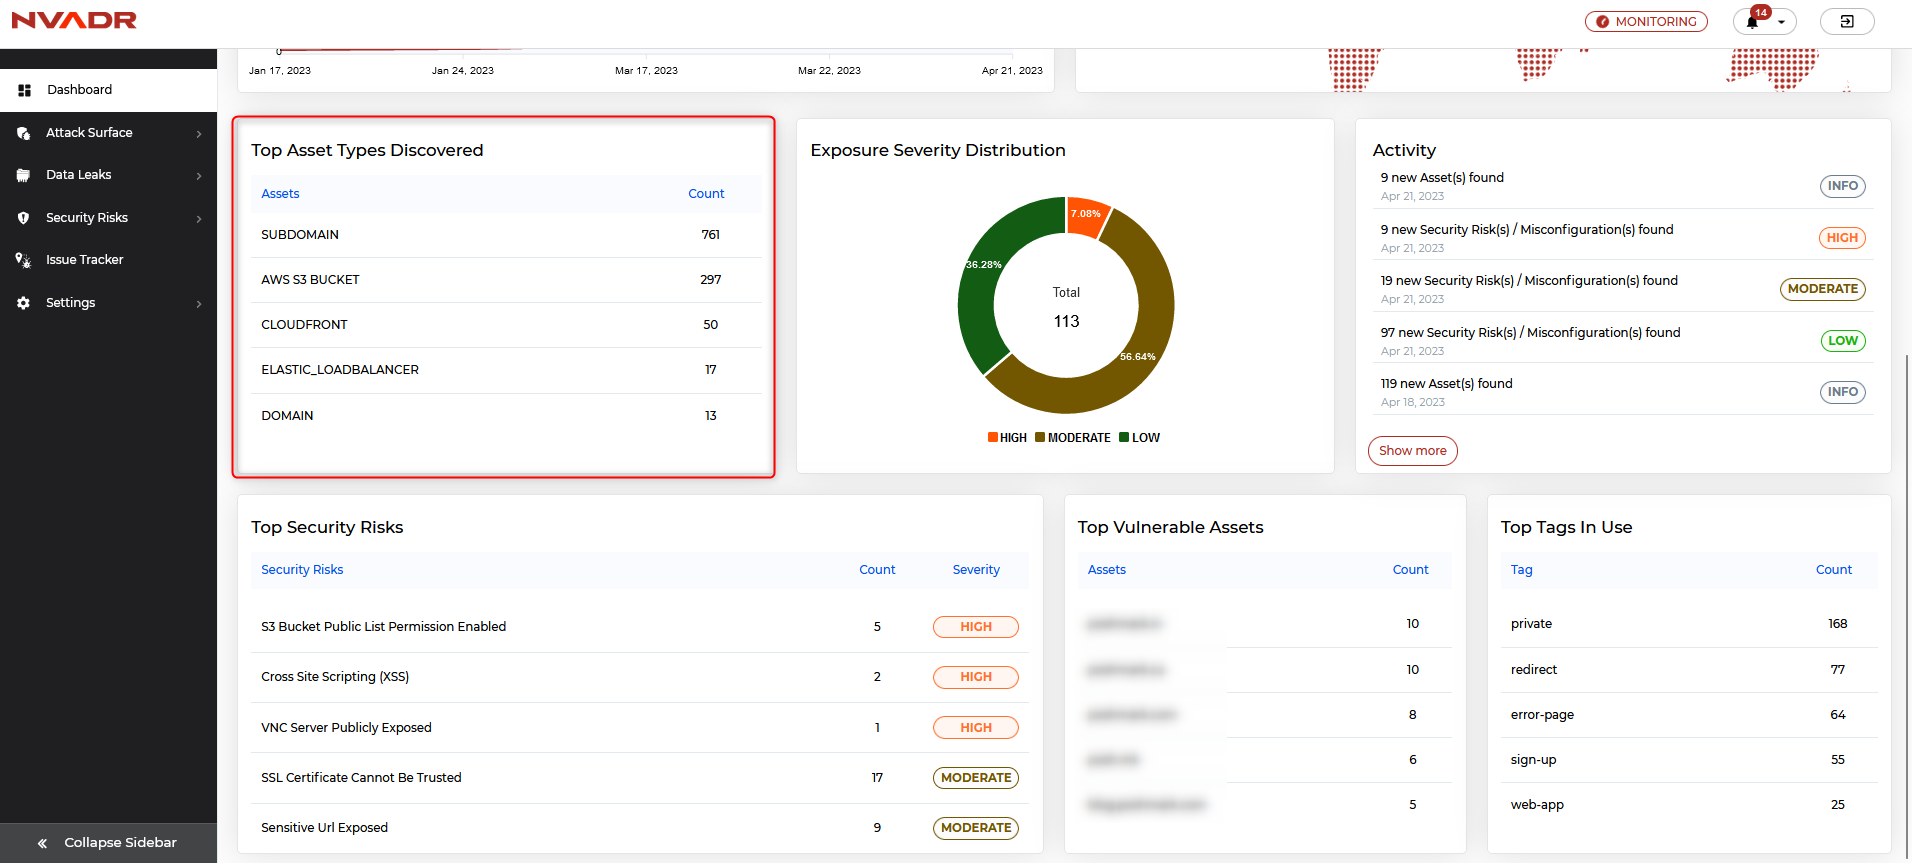
Top Security Risks
- This section lists the top active vulnerabilities for your organization along with their severity.
- On clicking on any of these vulnerabilities, you will get the details of it in Security Risks ⟶ Detailed View.
Top Vulnerable Assets
- This section lists the assets and the number of vulnerabilities they have in the descending order.
- On clicking on any of these assets, you will go to the asset exposure page with all the details about the selected asset.
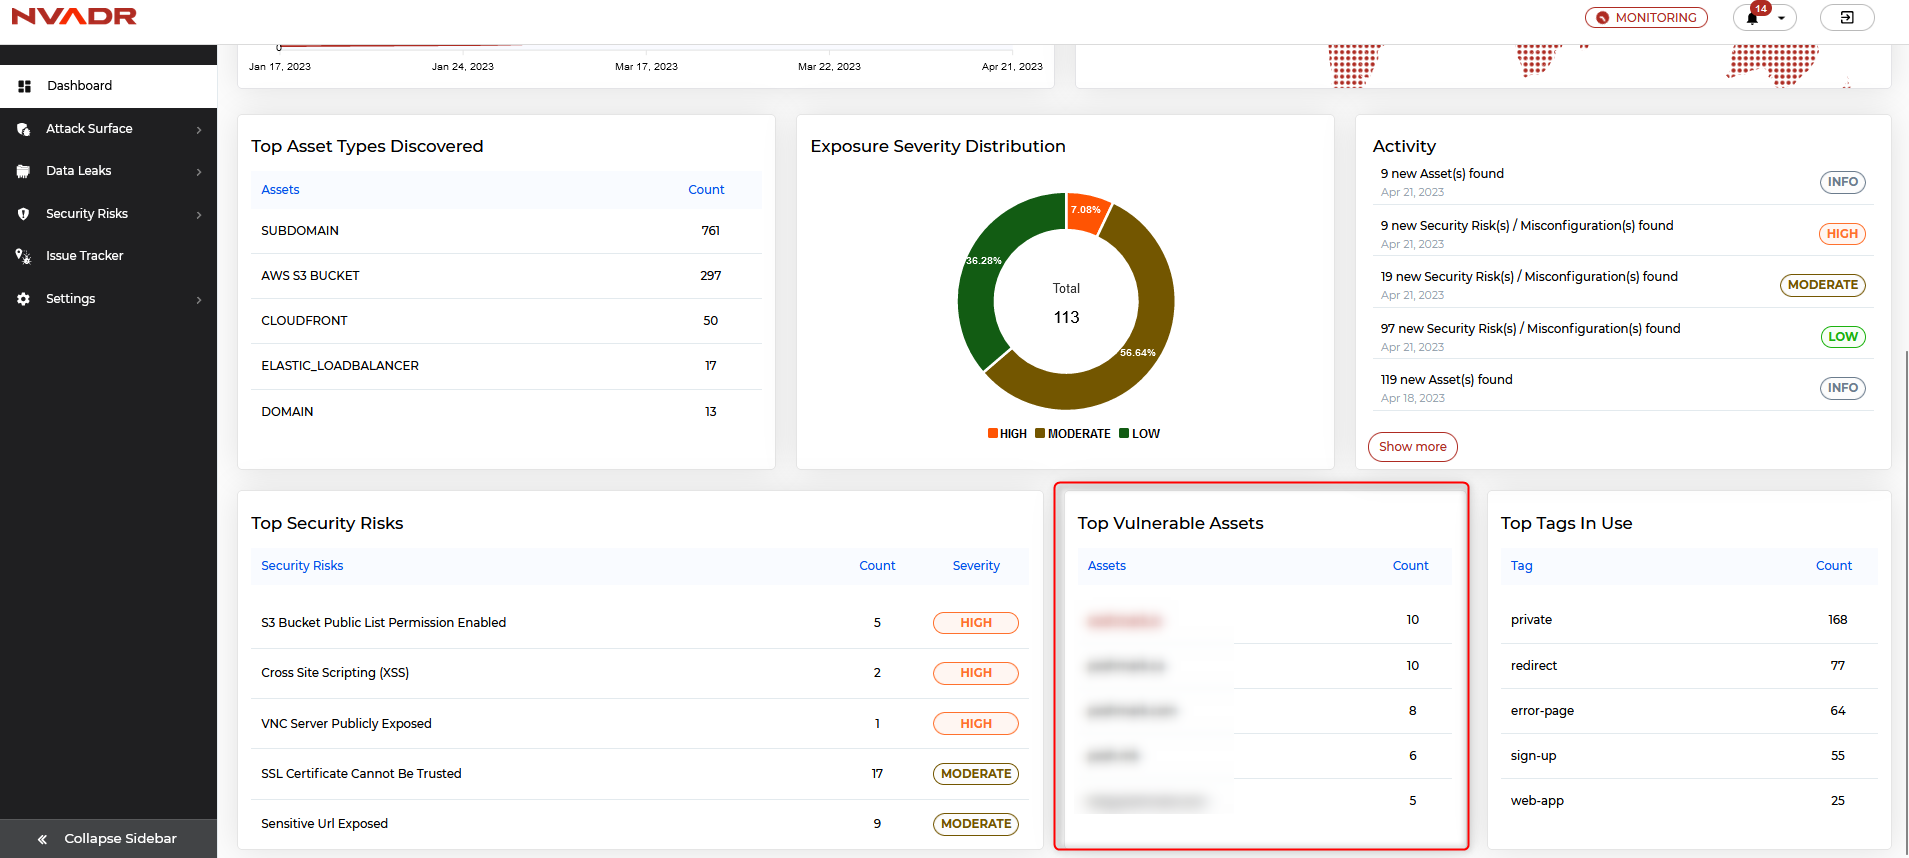
Top Tags In Use
- This section lists the top tags for assets along with their count.
- On clicking on any of these tags, you will get all the records for the selected tag on the asset exposure page..